Colorblindness Inclusion in NSD
In September 2022, Jayson Vavrek, a postdoctoral researcher within the Applied Nuclear Physics program, gave a presentation at the NSD staff meeting about the need to consider the choice of colors when creating figures and other graphics so that we can better include those who are colorblind or are affected by another form of color vision deficiency (CVD). Measurements vary, but approximately 2–10% of men and 0.1–3% of women have some form of CVD, so a substantial proportion of your audience (roughly 5%) may have some difficulty perceiving color.
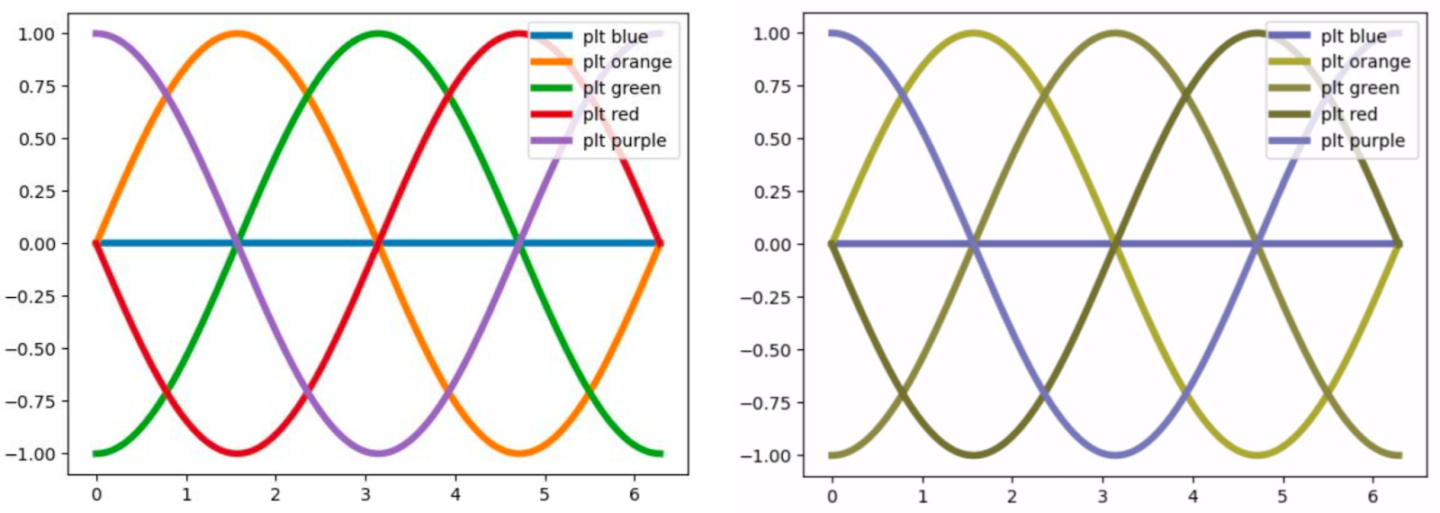
Jayson pointed out that although many popular scientific plotting packages have switched to colorblind-friendly default palettes in recent years, it is still important to consider how one’s plots and other graphics will be perceived by those with different abilities to see color. For example, here is a plot using matplotlib’s default color scheme, with the version on the right being adjusted to what a person with deuteranopia (or red-green colorblindness, the most common form of CVD) would see: